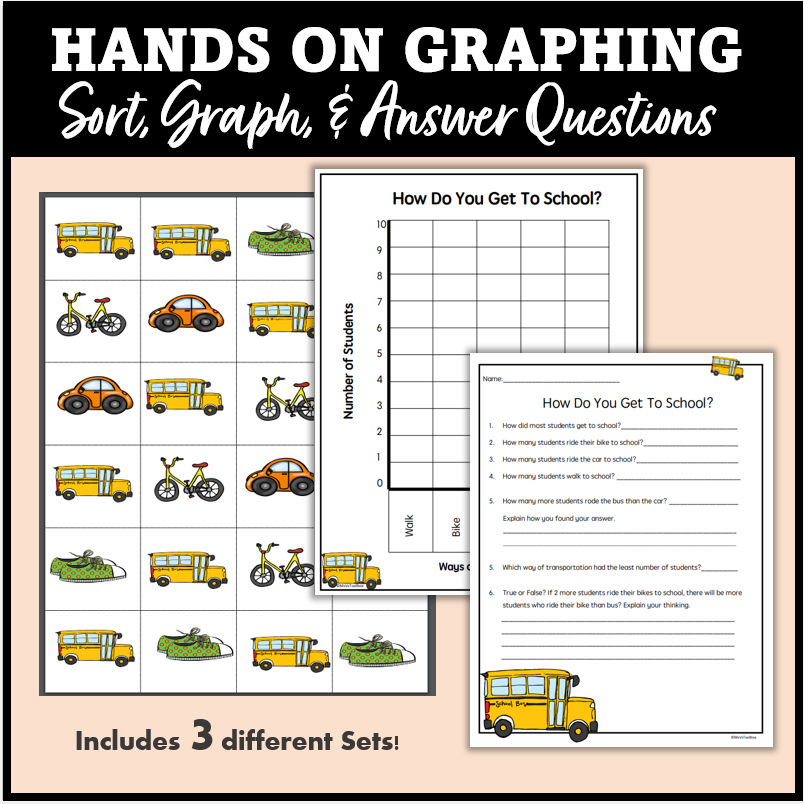
Helping elementary students develop the skills to read, analyze, and interpret data can be a challenging task. Graphs, charts, and tables often appear complex to students, and the skills required to make sense of them—such as understanding data points, comparing values, and drawing simple conclusions—don’t always come naturally.
Here are five effective strategies that will help your students become more confident in reading, analyzing, and interpreting data.
1. Use Real-World Examples to Build Engagement
Use familiar examples to make data relatable, whether it’s favorite snacks in elementary or social media statistics for older students. When students see the connection between data and real-life scenarios, they become more interested and engaged.
2. Introduce Graph Types One at a Time
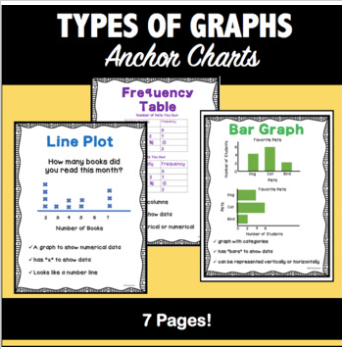
With so many types of graphs and tables, students can feel overwhelmed if presented with too much at once. Begin with bar graphs, which are often the easiest for students to understand. Once they’re comfortable with basic comparisons in bar graphs, introduce other types like double bar graphs and line plots. Slowly layering in different types allows students to practice with each one, gaining familiarity and building the skills they need to tackle more complex data.
Need Anchor Charts? Check out the resource below!
3. Have Students Answer Questions with Evidence
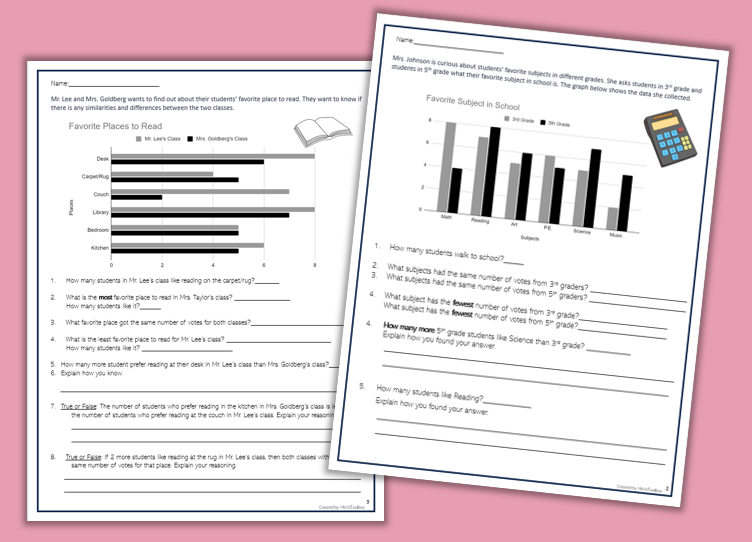
To help students focus on understanding data points and making sense of the information, use worksheets that require evidence-based answers. Questions like “How many more students chose A than B?” or “Which option is least popular?” prompt students to find answers directly in the data. Adding questions that ask them to explain their reasoning further strengthens their ability to read and analyze data. Over time, this practice helps students feel more confident in their ability to interpret data independently.
4. Encourage Group Work/Partner Work for Data Interpretation
Group work helps students share perspectives and learn from one another. In pairs or small groups, they can compare interpretations, discuss findings, and debate conclusions. This collaboration encourages critical thinking and sparks discussion. Whether it’s an elementary group discussing survey data or a high school class debating statistical interpretations, working together enhances understanding and engages students in lively, meaningful discussions.
5. Have Students Create Their Own Graphs
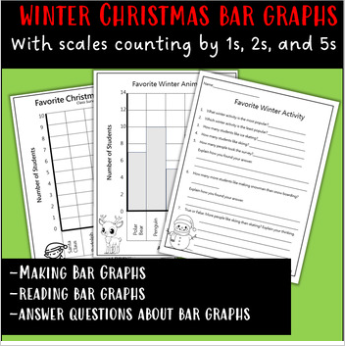
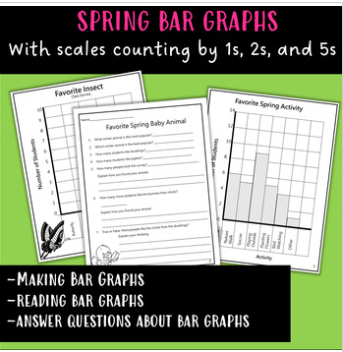
One of the best ways for students to understand data is to create their own graphs. Start by gathering simple data as a class—like favorite foods or daily weather patterns—then guide students in organizing this information into a graph. By collecting data, choosing the right type of graph, and plotting it themselves, students get hands-on experience with each step of data interpretation. This activity reinforces their understanding of how data is represented visually and helps them become more comfortable reading and analyzing graphs in the future. Plus, creating their own charts adds a level of ownership and engagement that makes data analysis more meaningful.
Looking for more ready-to-use resource?
This data graphing unit includes worksheets all types of data and graphs, including single bar graphs, double bar graphs, frequency tables, pie charts, and line plots. Perfect for Grades 2 and up!
Here’s what one high school teacher had to say about this resource:
“My high school students with a wide range of math abilities are doing a probability and statistics course and, to get them ready, we started with this packet. They were very excited by it and liked that it was easy enough to approach independently. I hear them debating answers, and they’re getting better at explaining data, which was my goal before we get to the ‘mathier’ stuff. They are slowing down and actually looking at the data now, which will set them up better for success as our course ramps up. This is a first-hour course, and they come in, sit down, and start working right away. I had no idea they’d like it this much! You should HEAR them argue with each other about answers and then justify how they got them with such passion!”
